Research
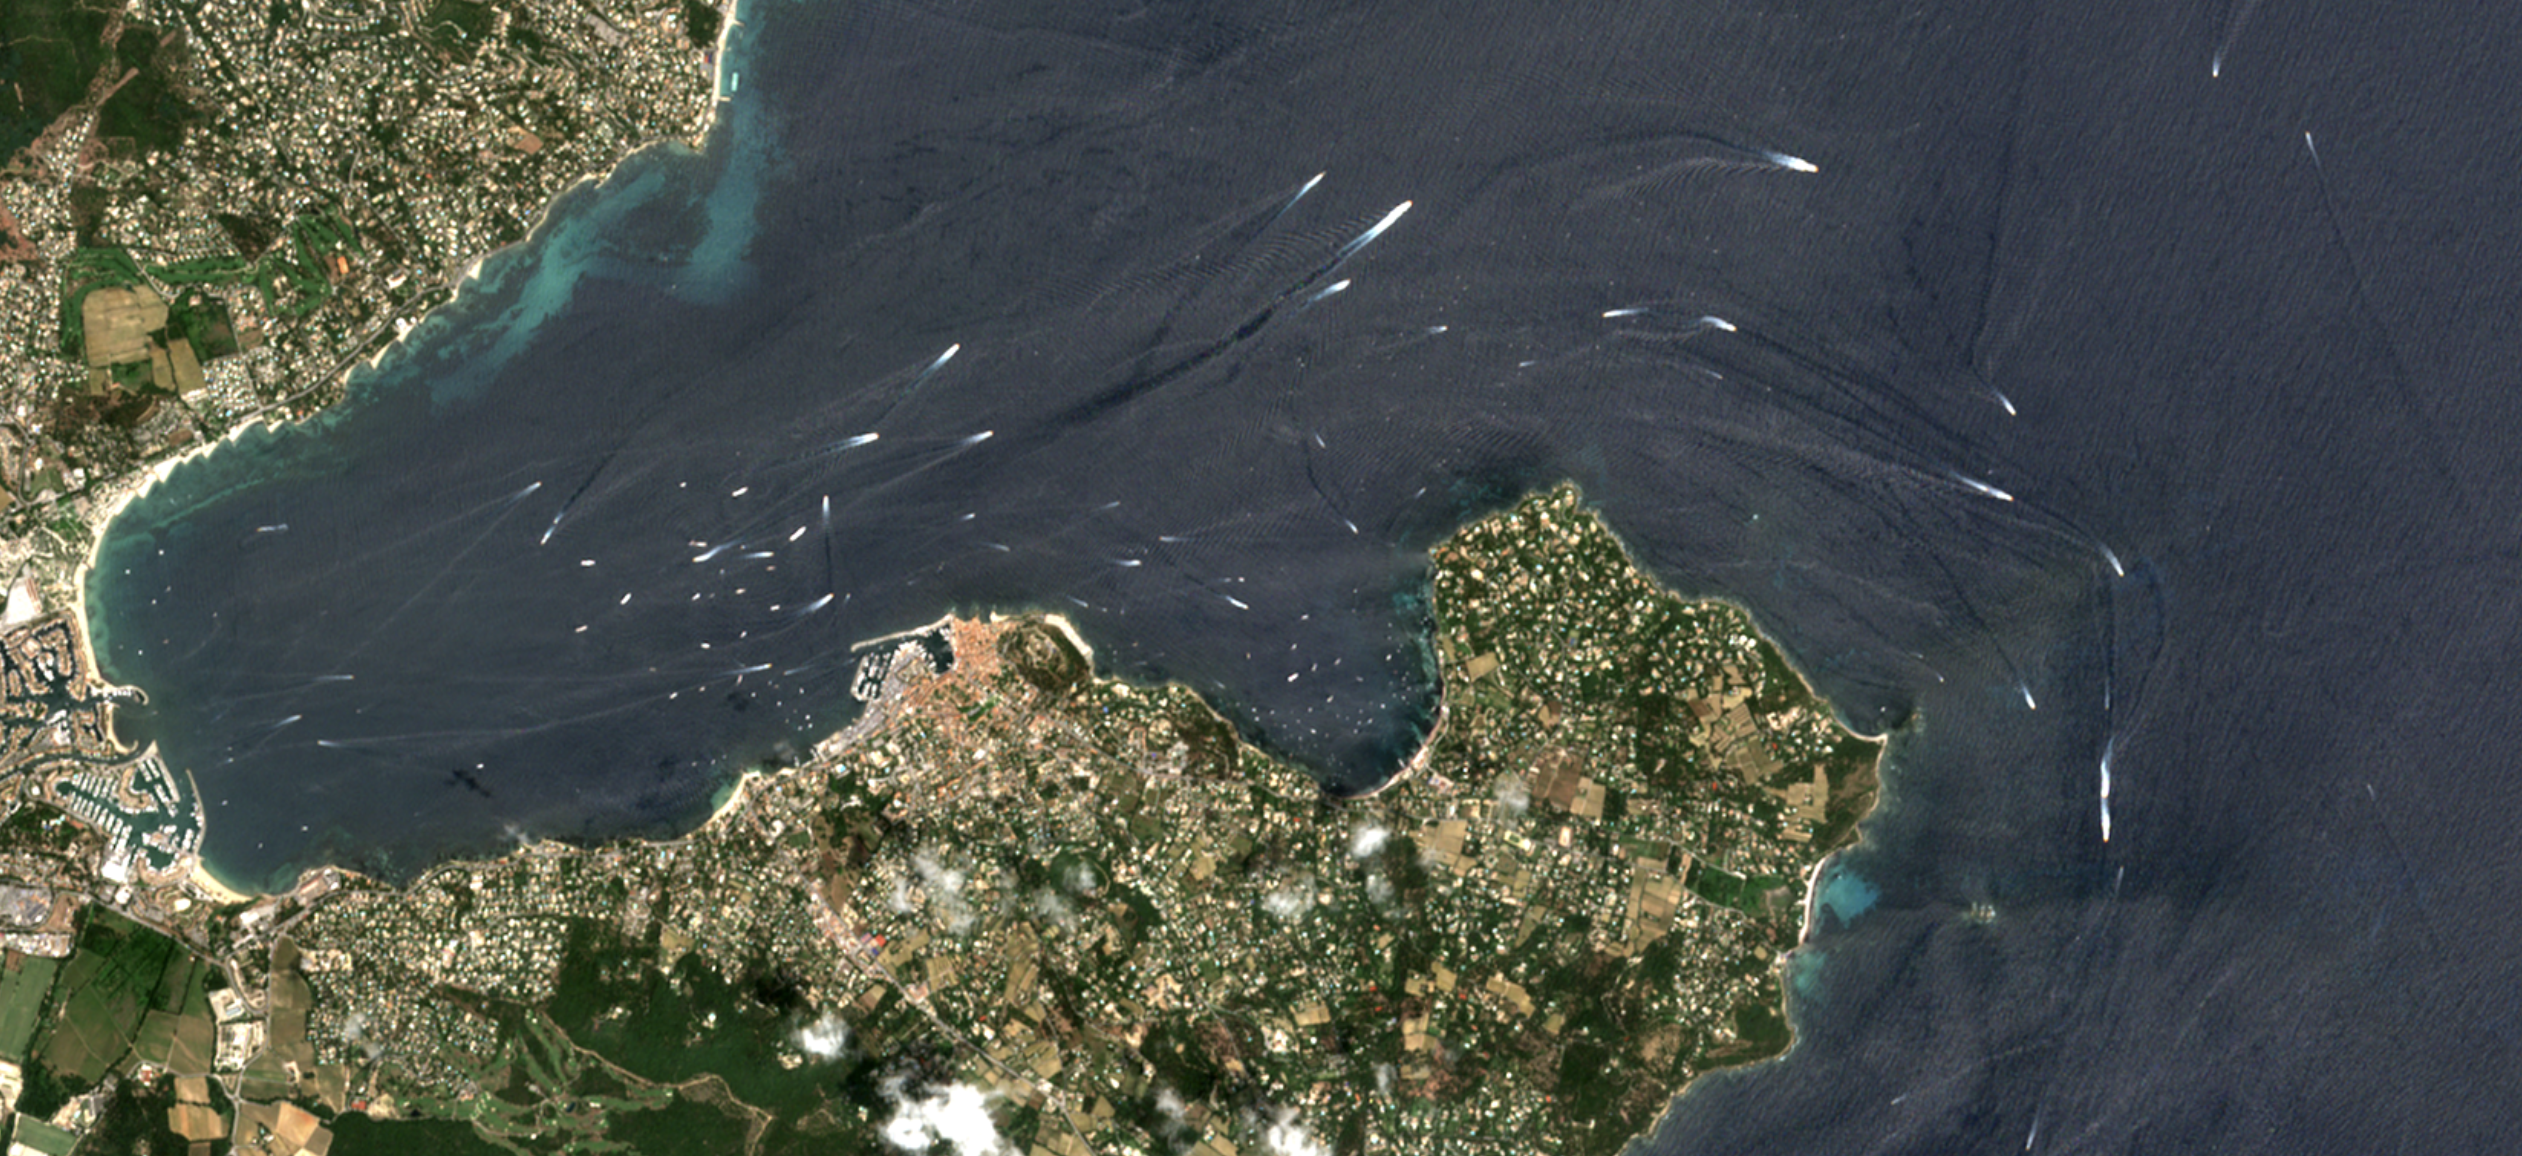
Vessel Detection. AI detects three times more ocean vessels from satellite imagery, including smaller ships missed by public tracking systems.
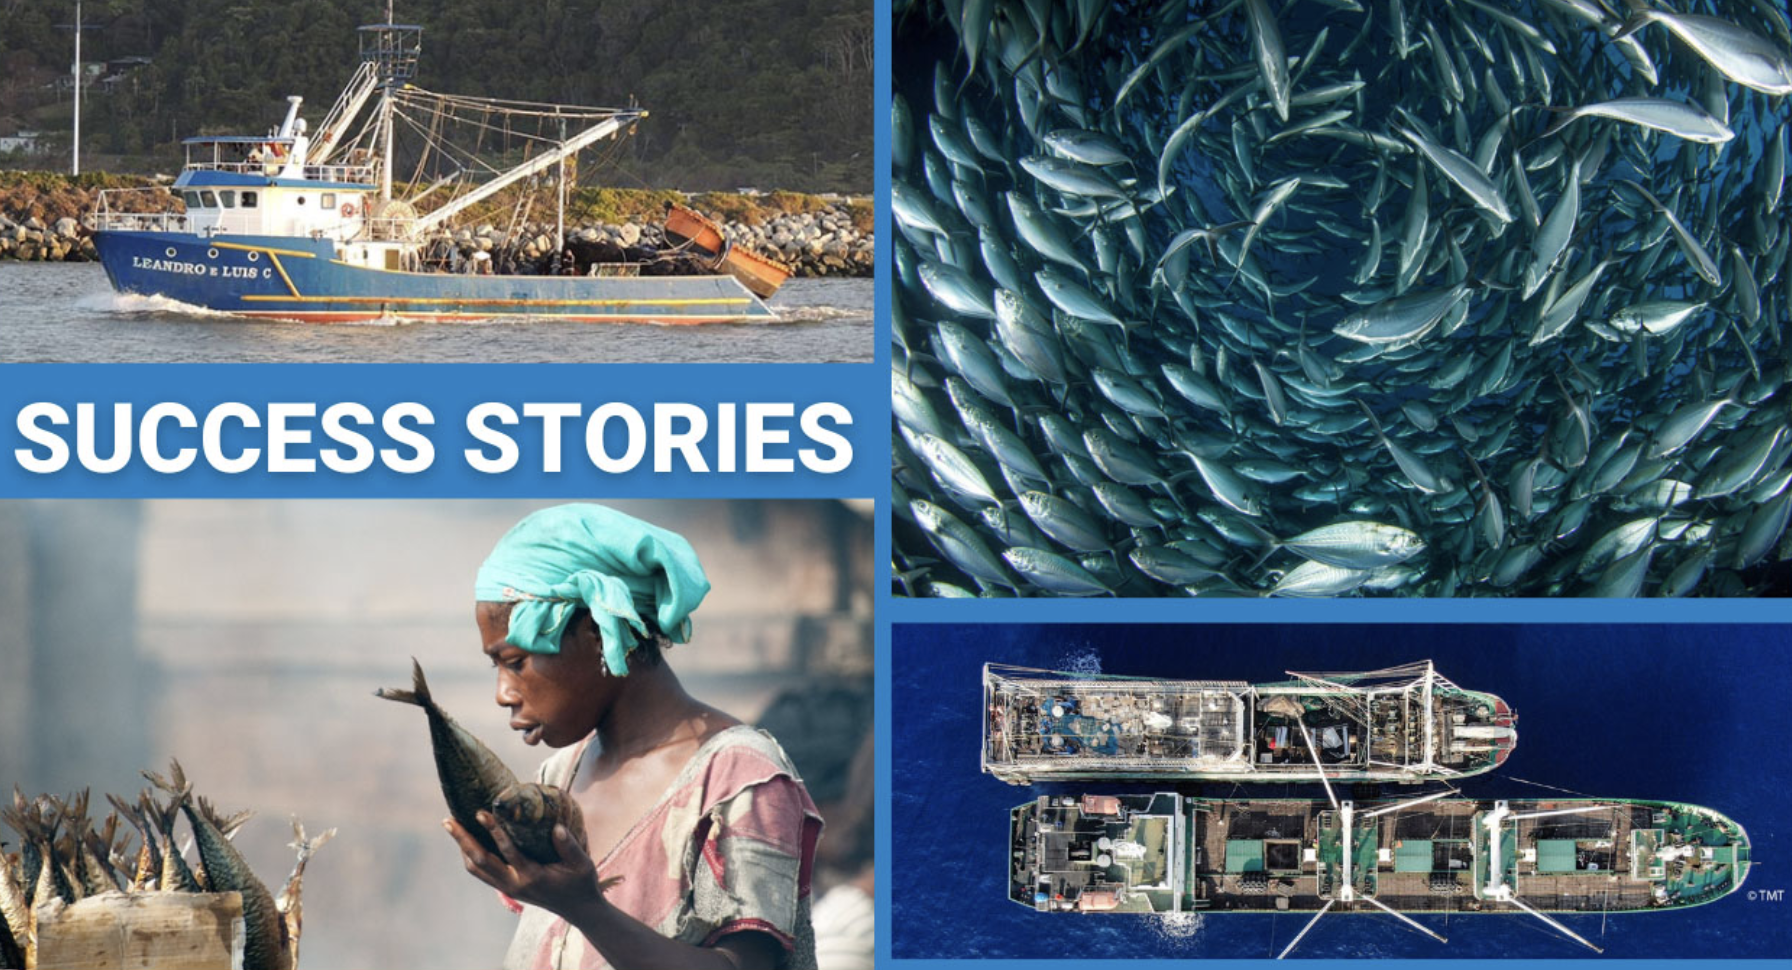
Emissions. Industrial vessels emitted 1.3 billion tons of CO₂ in 2023, up 20% since 2016, mapped globally for the first time.
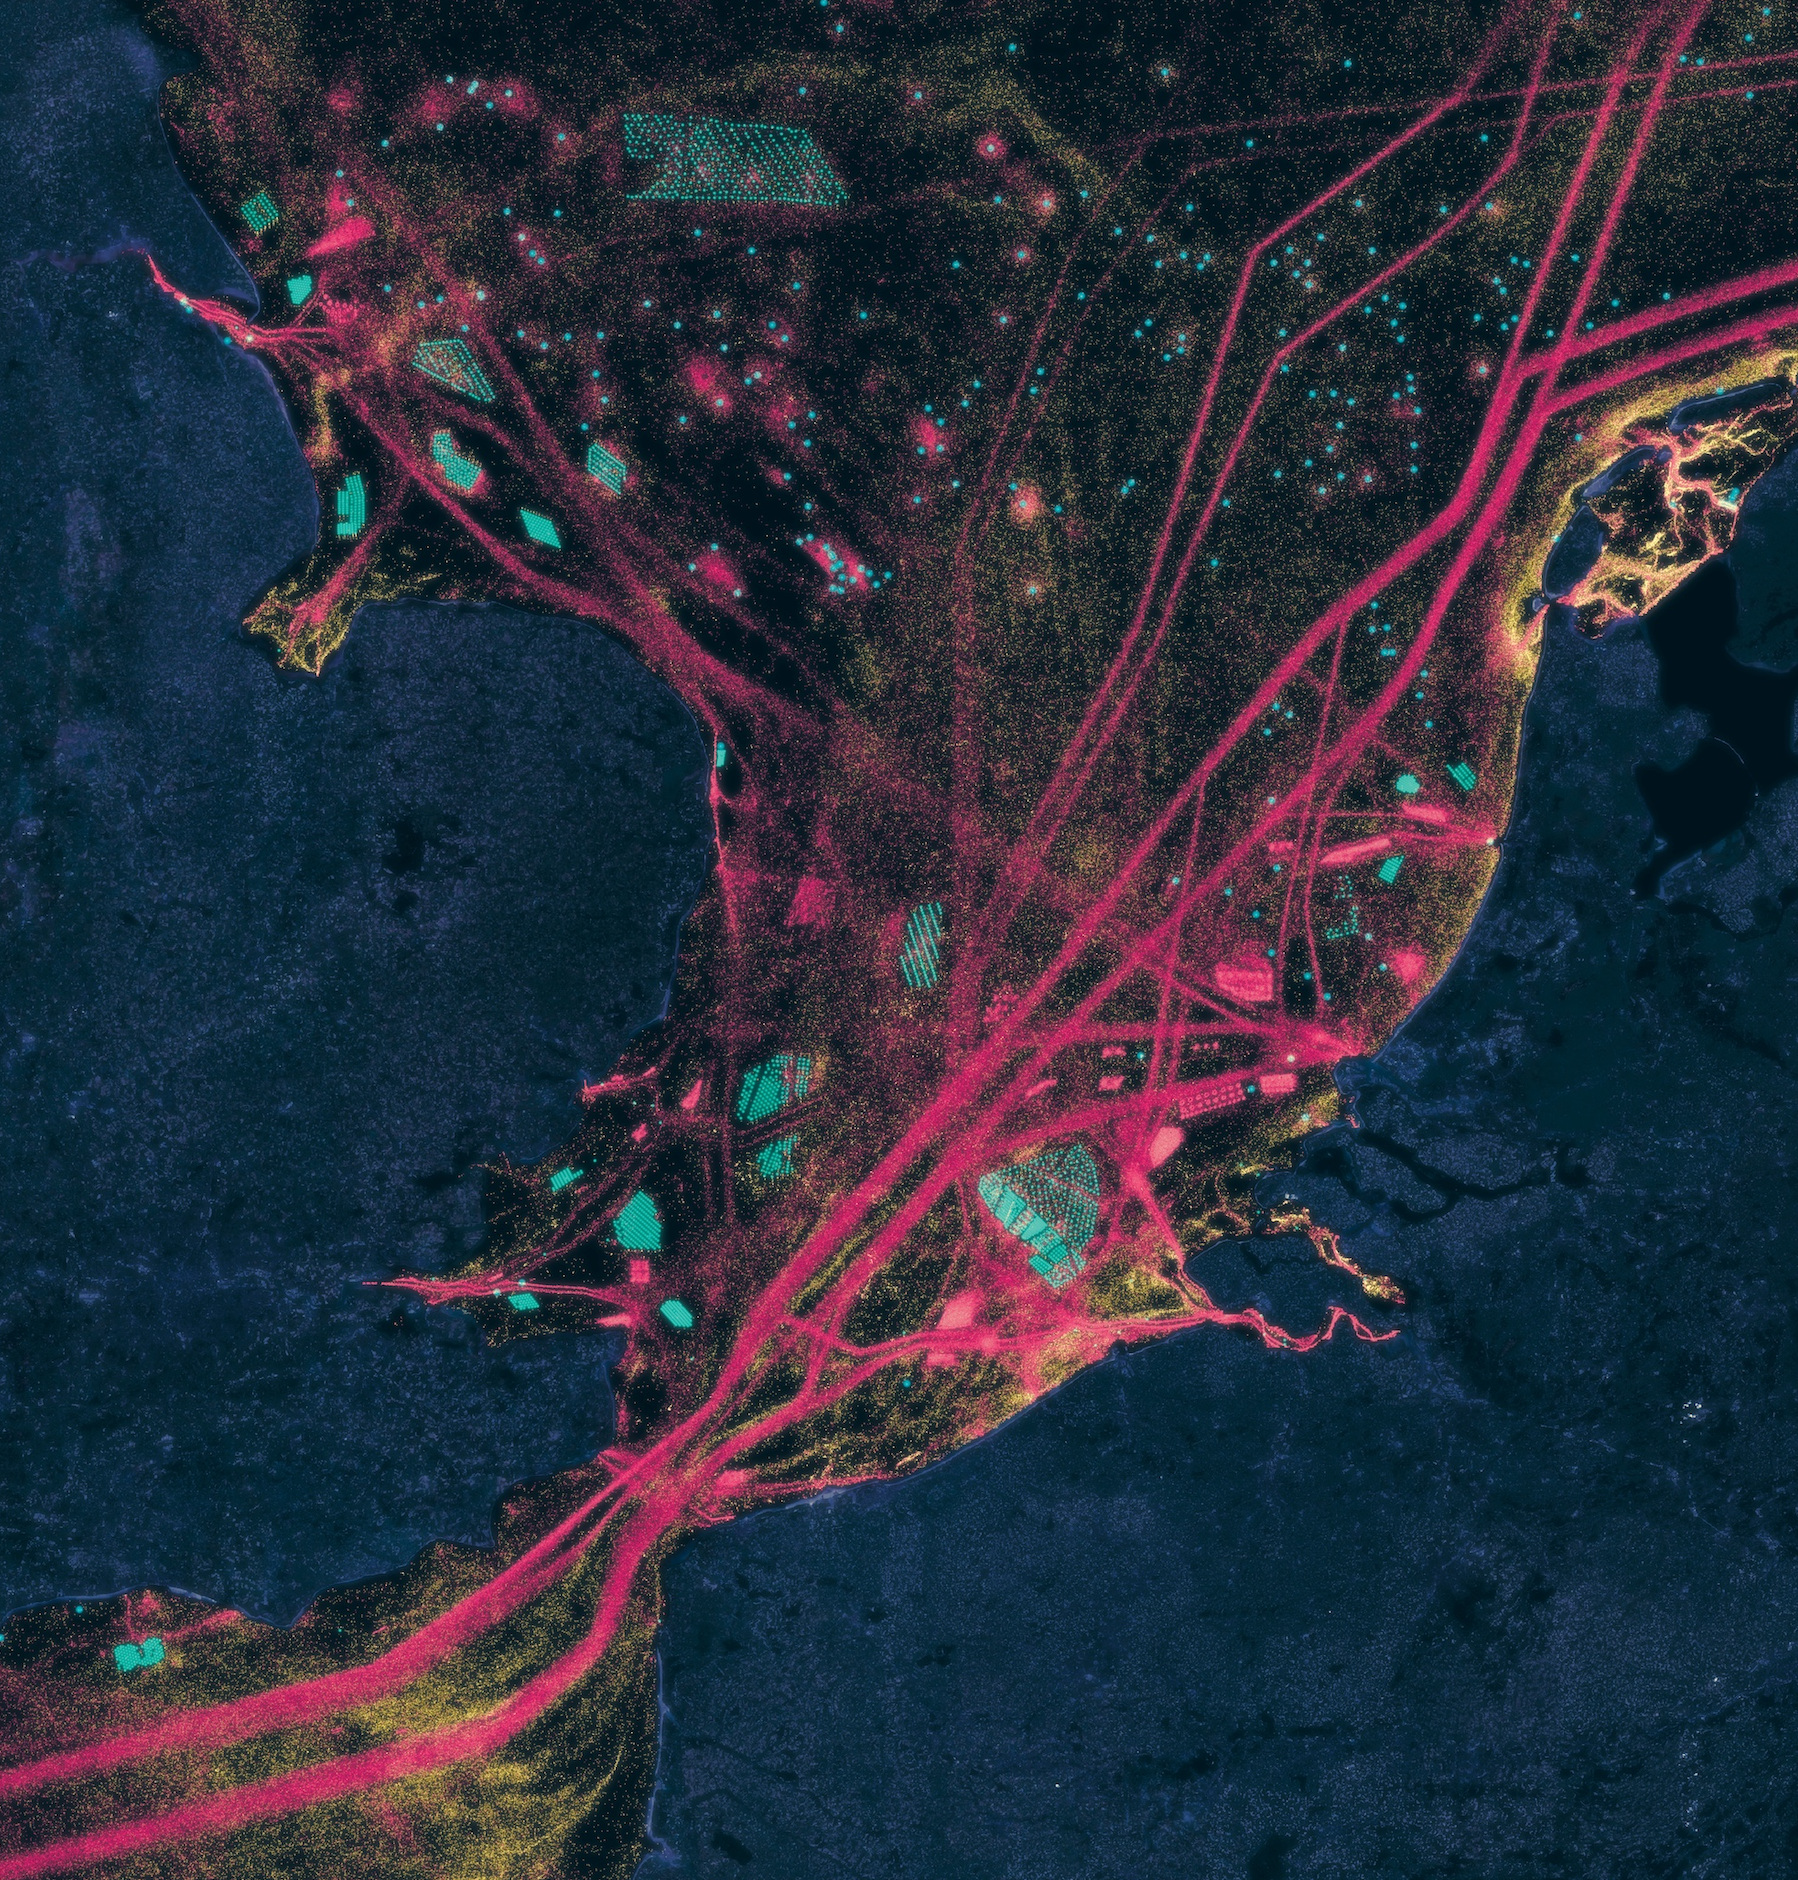
Transparency. 72–76% of industrial fishing vessels are not publicly tracked.
Human Activity. Satellite data and AI reveal all industrial fishing, shipping, and offshore infrastructure globally, bringing full transparency to ocean use.
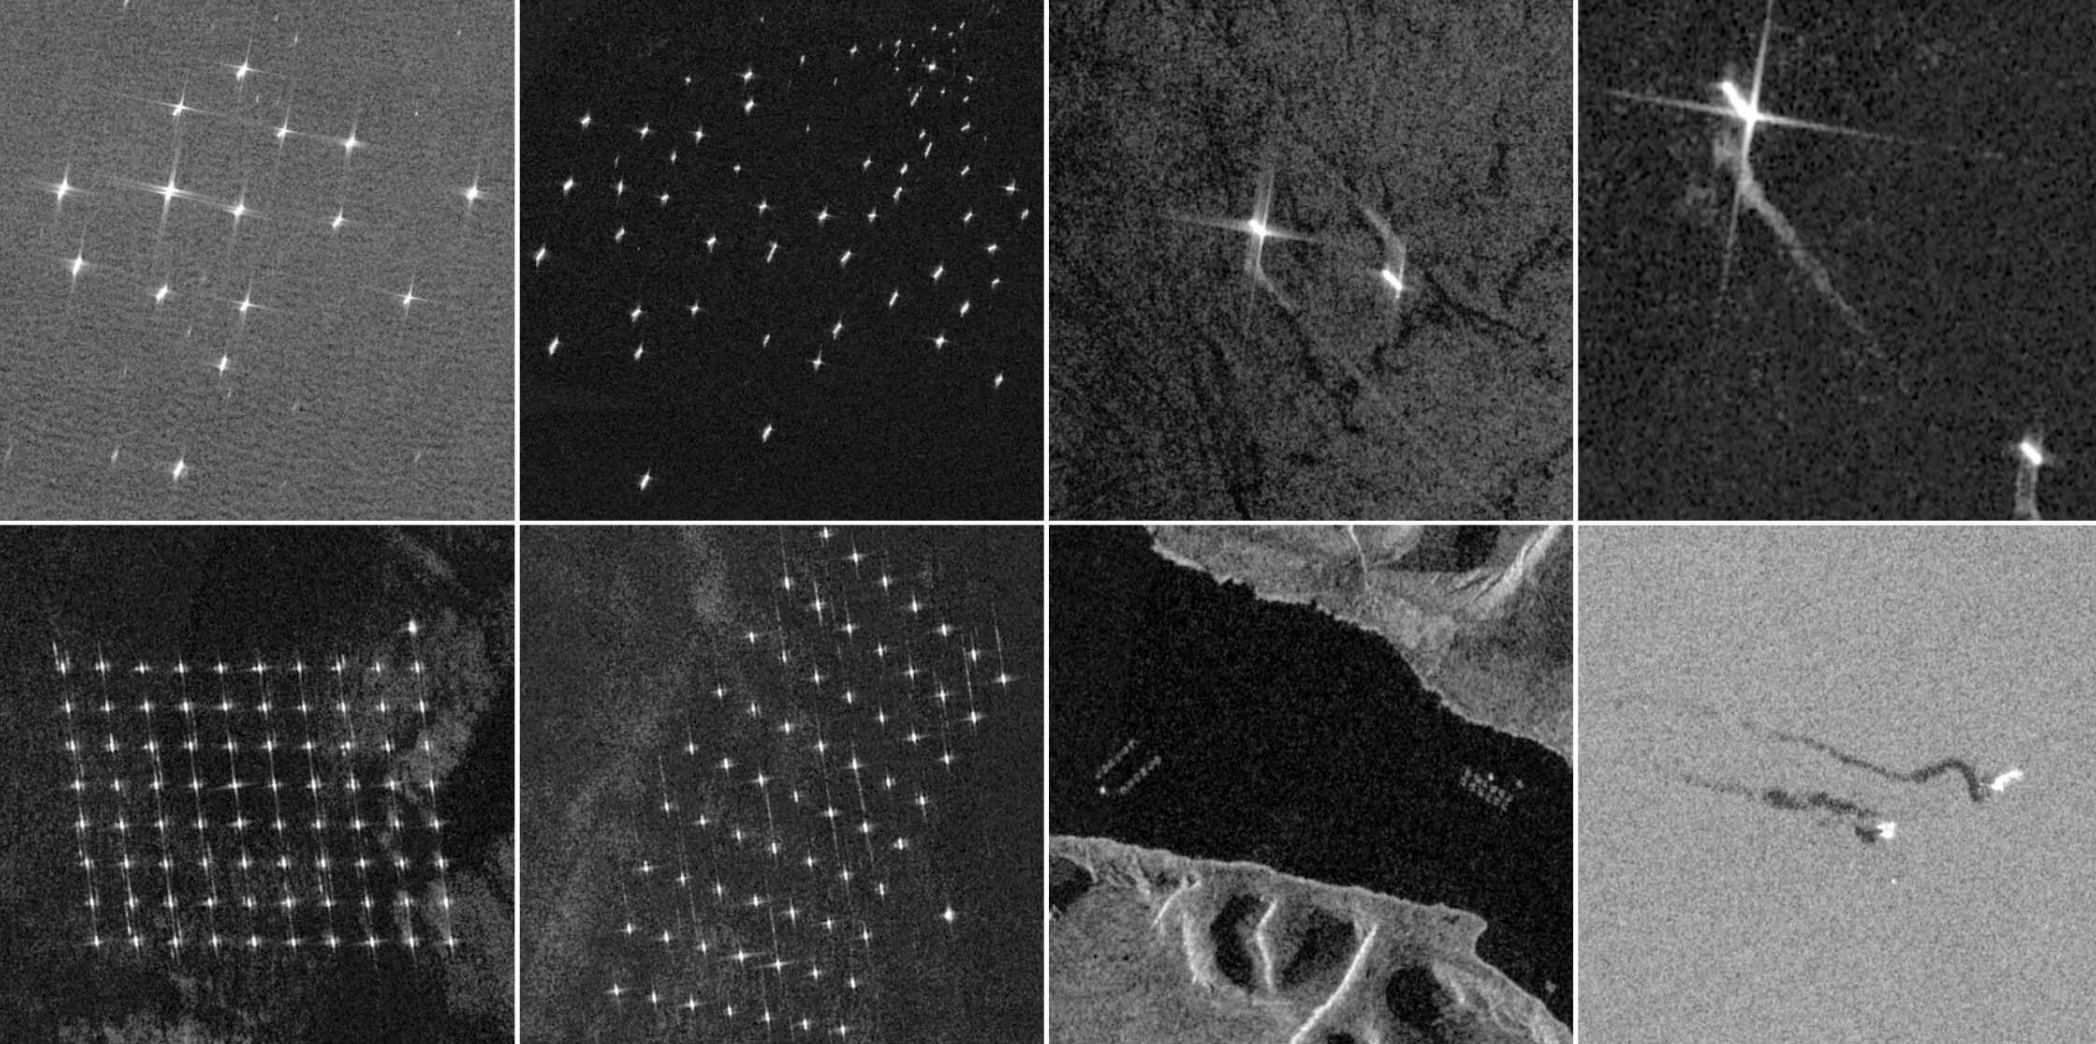
Dark Vessels. A neural network trained on SAR imagery detects vessels that deliberately disable their tracking transponders.
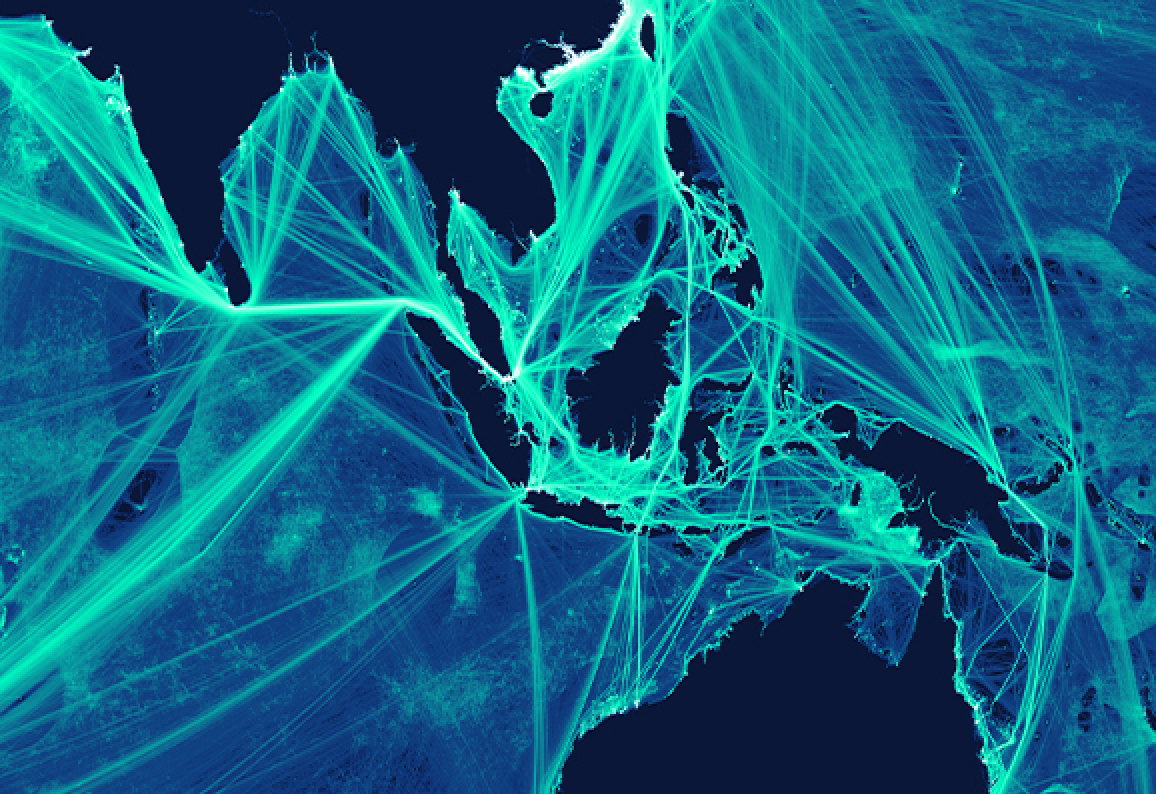
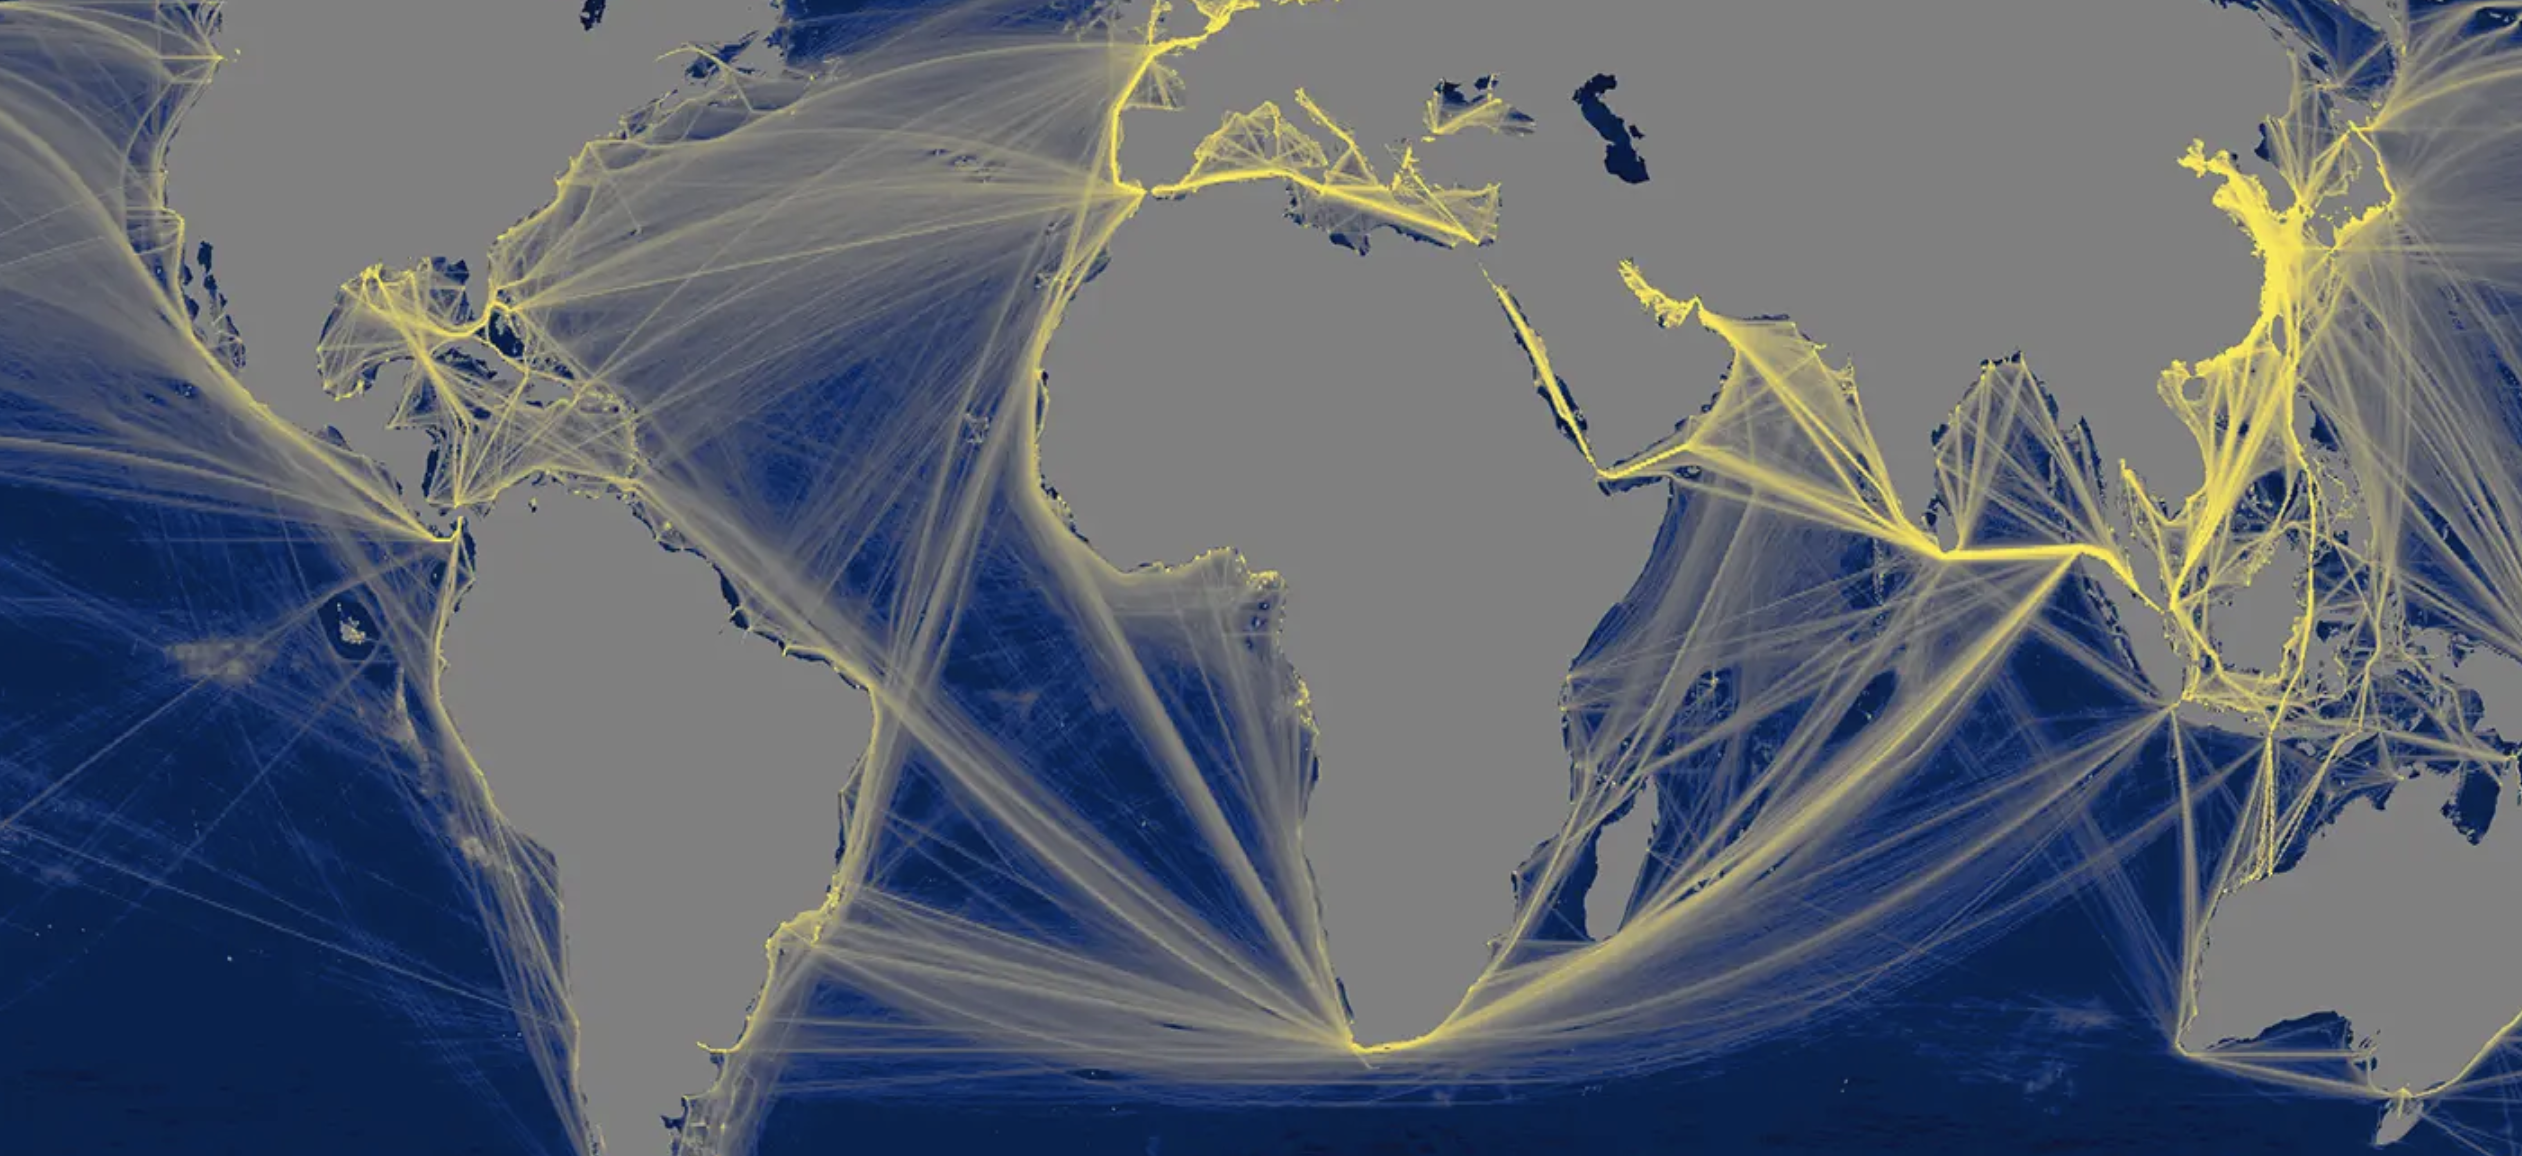
Vessel Tracking. Billions of satellite AIS positions reveal global vessel traffic patterns and hotspots.
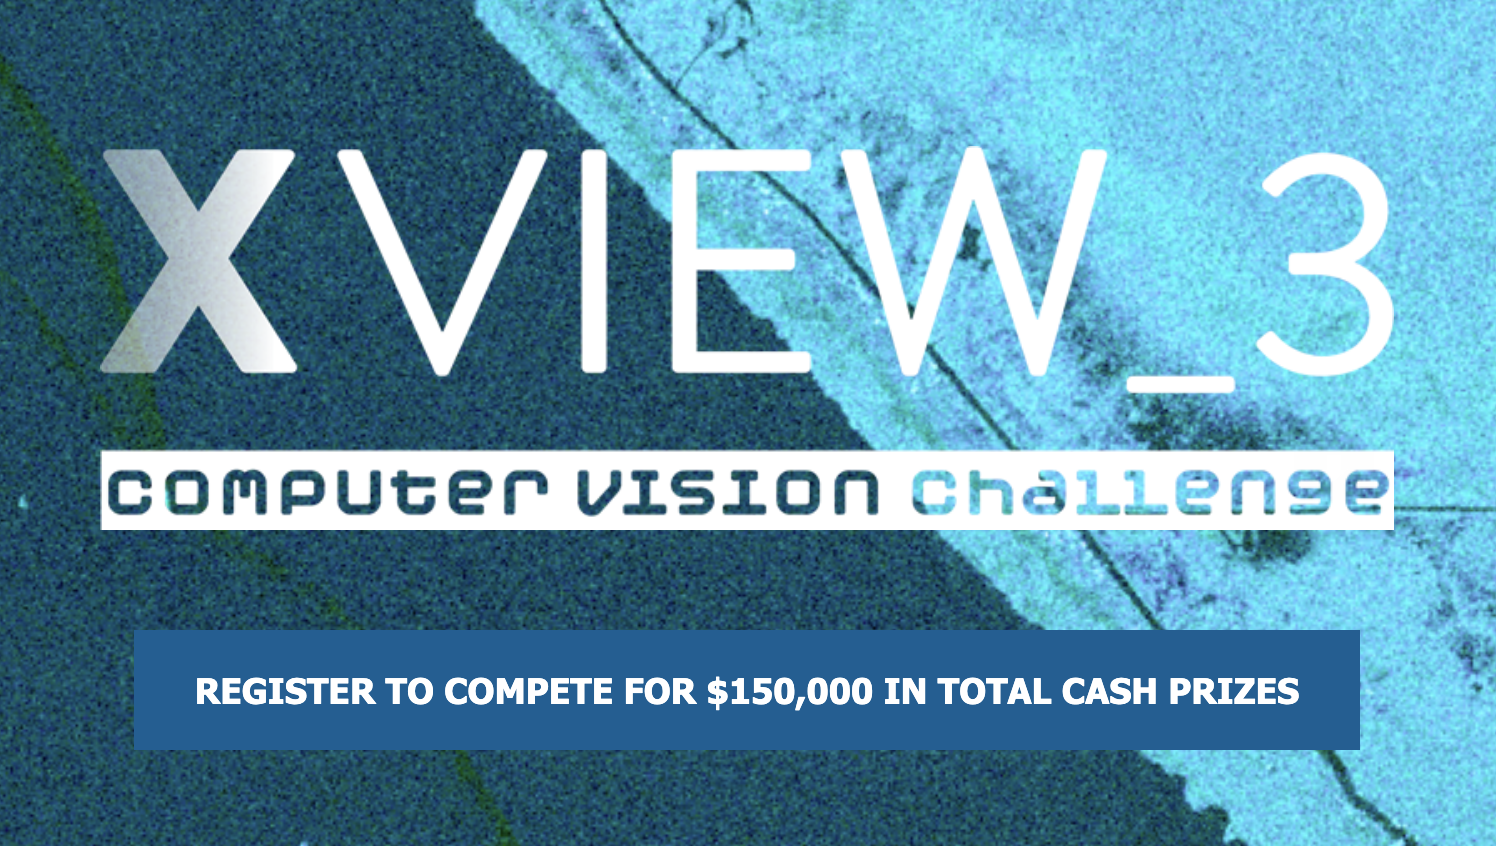
AI Challenge. The largest labeled SAR dataset for vessel detection, drawing 800+ teams from 64 countries.
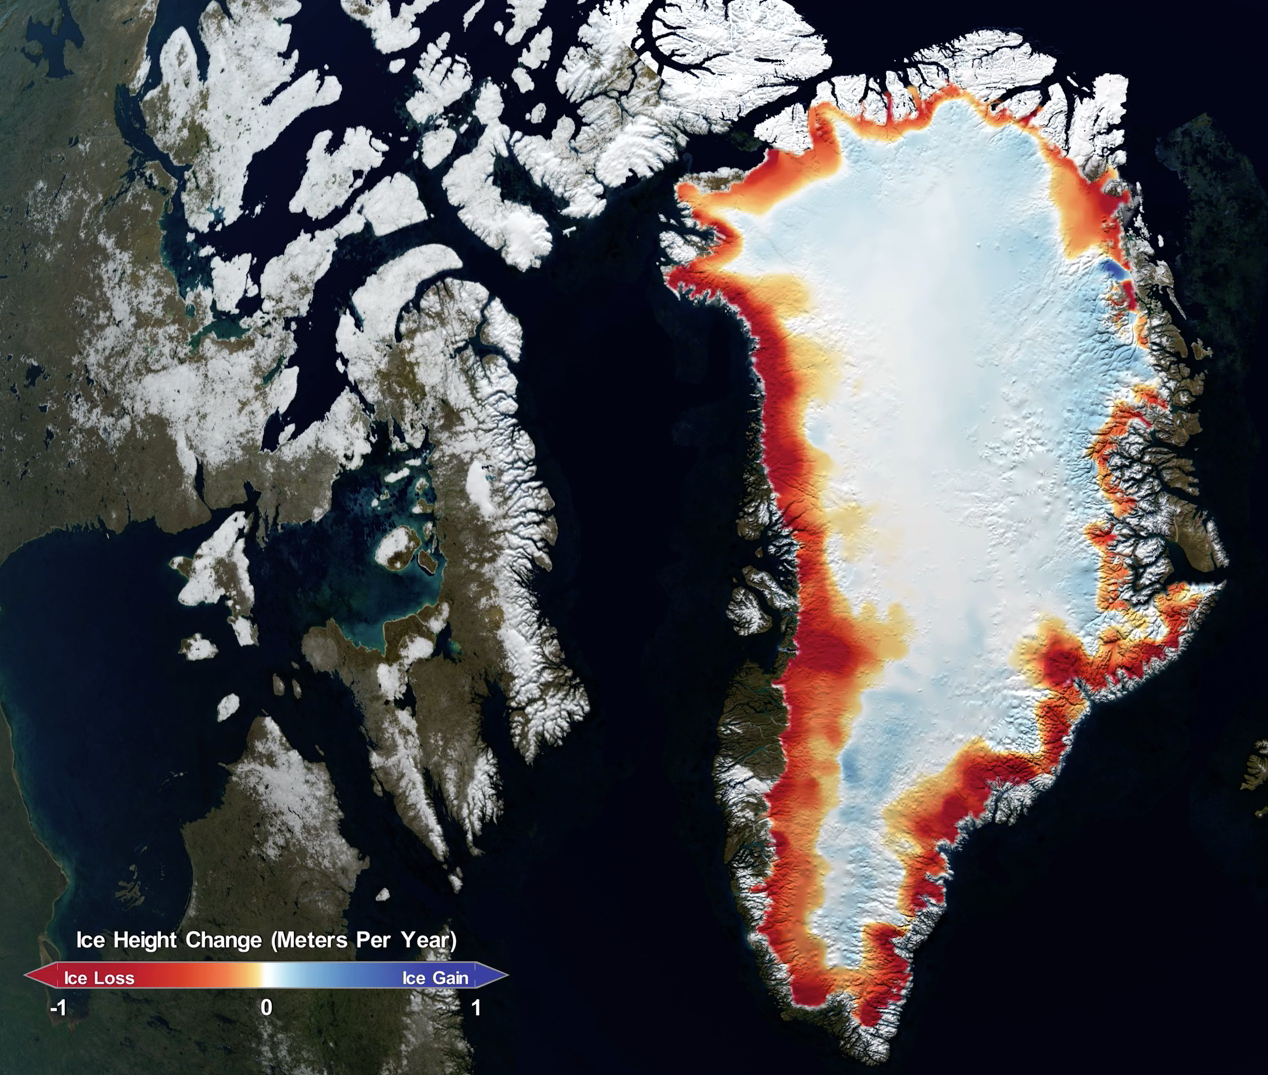
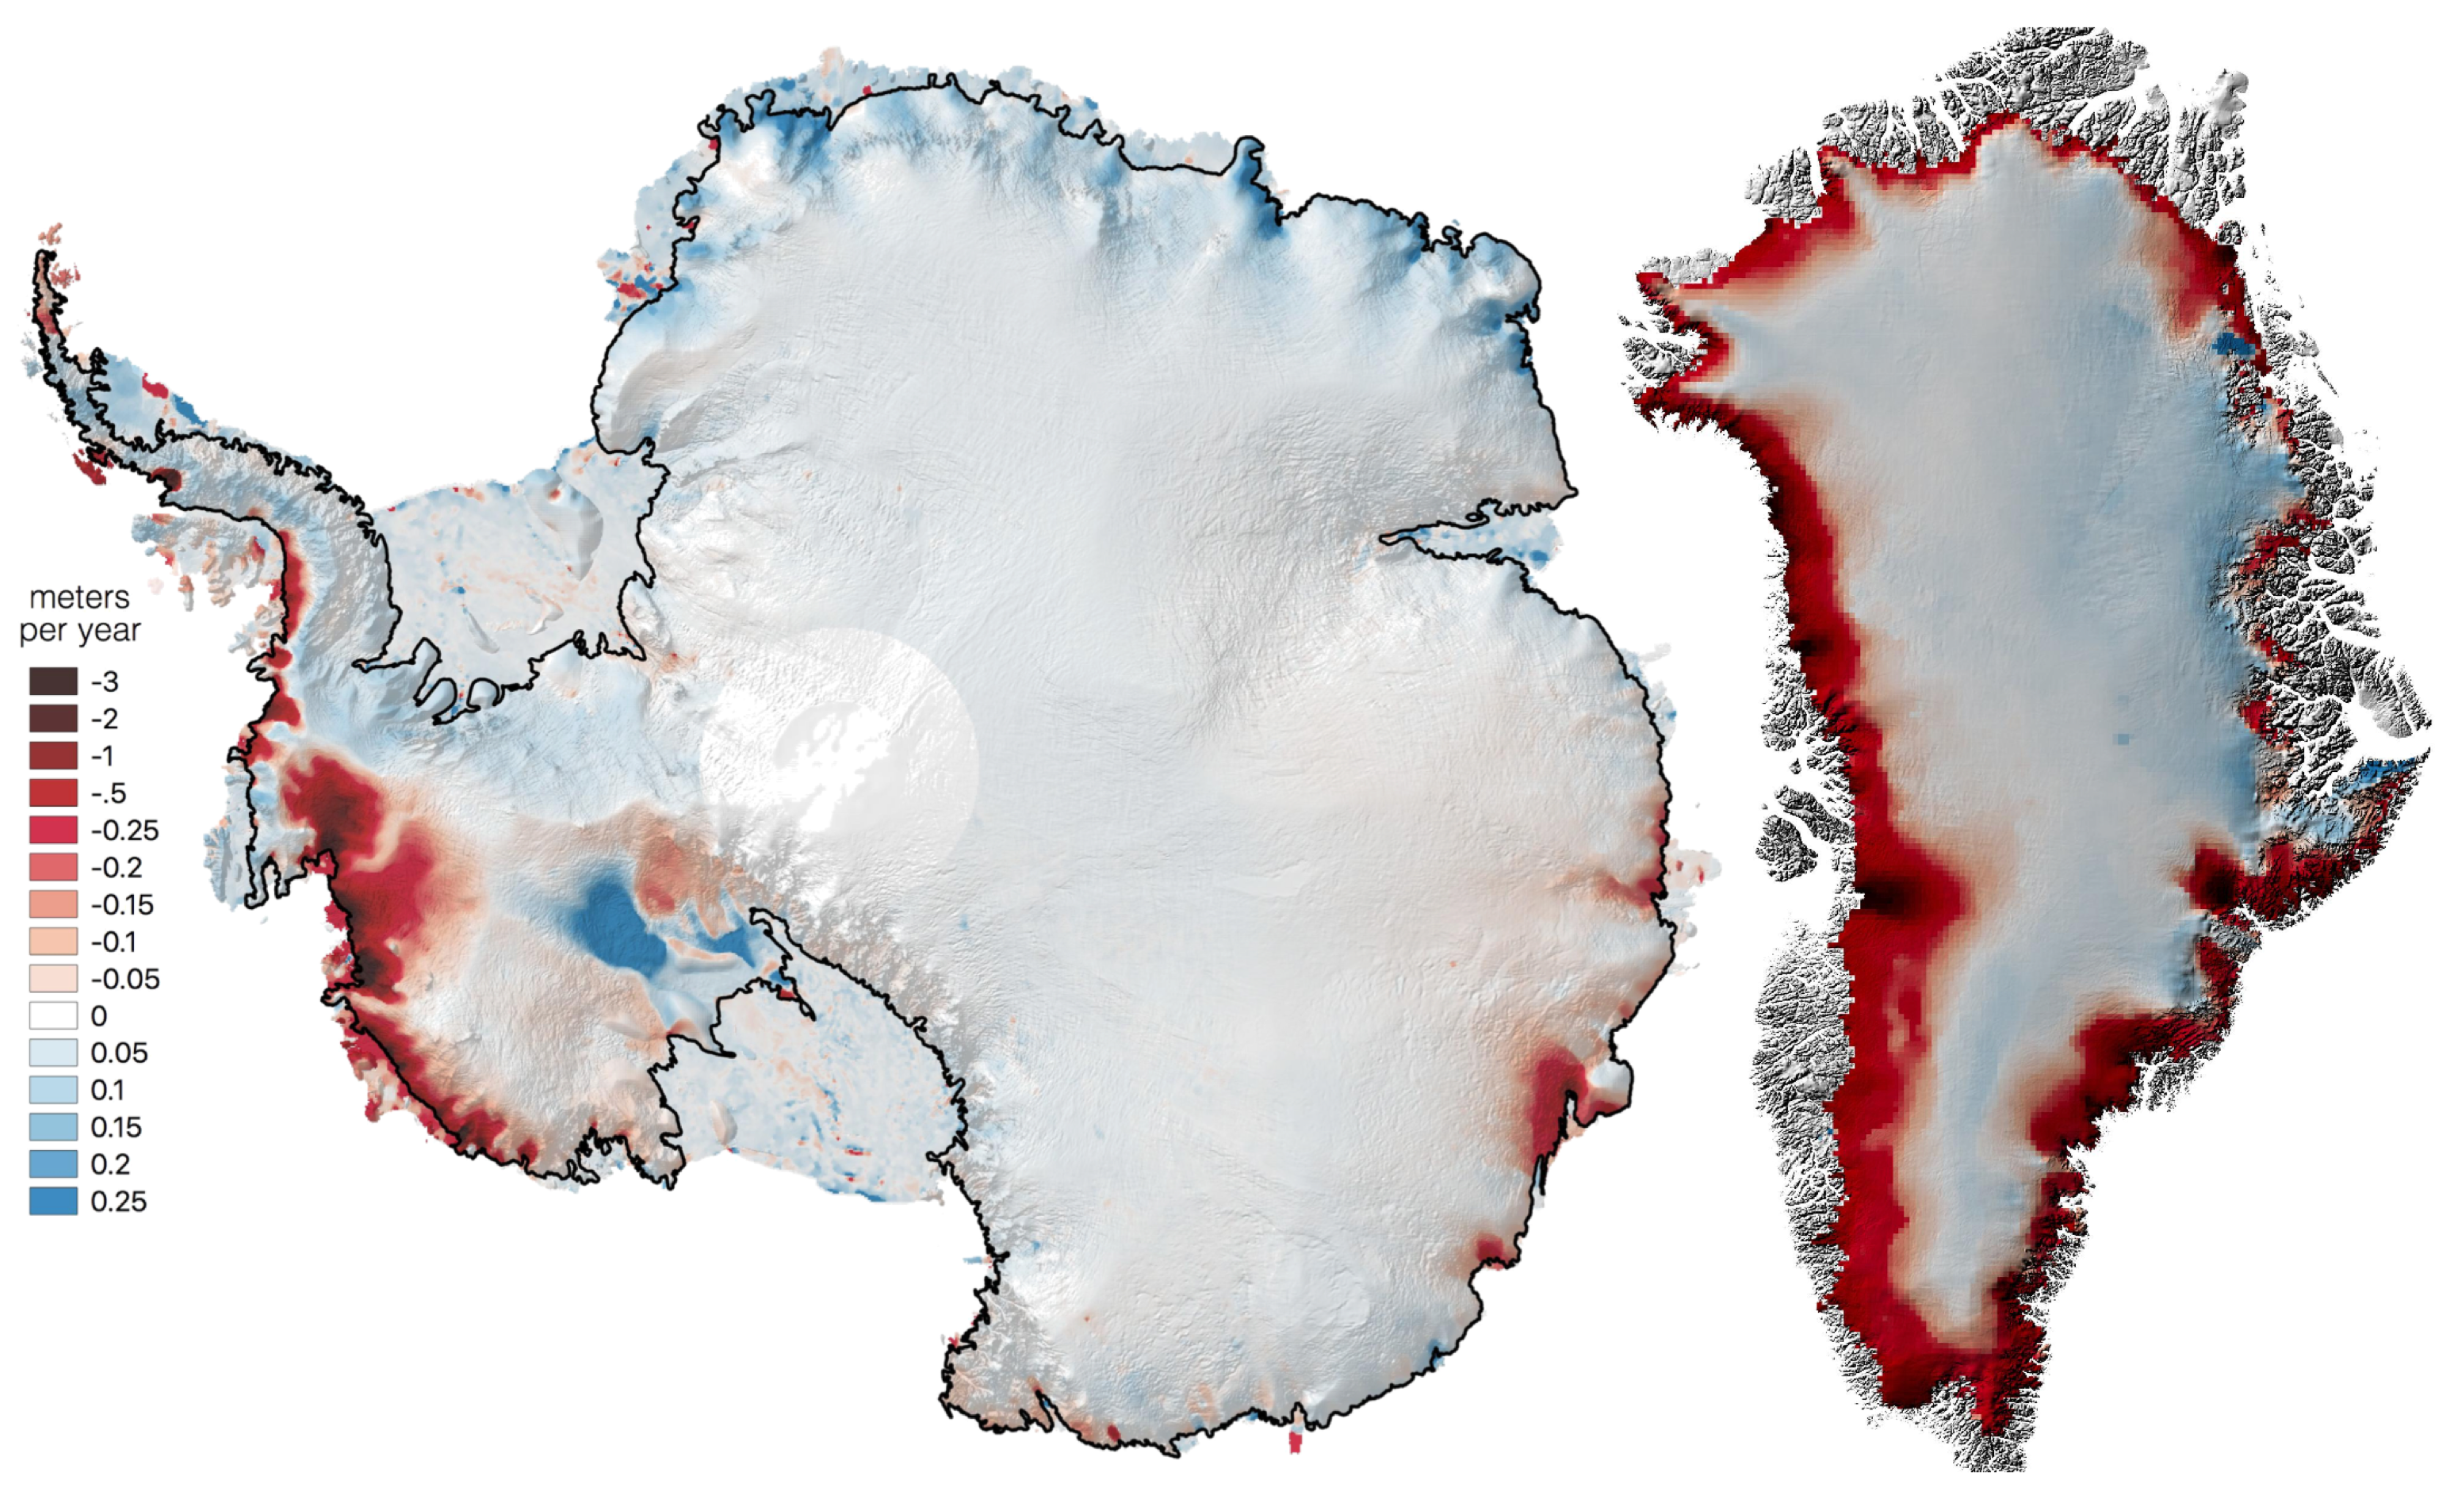
Ice Loss. NASA laser altimetry reveals accelerating polar ice loss from both ice sheets, raising sea level 14 mm over 16 years.
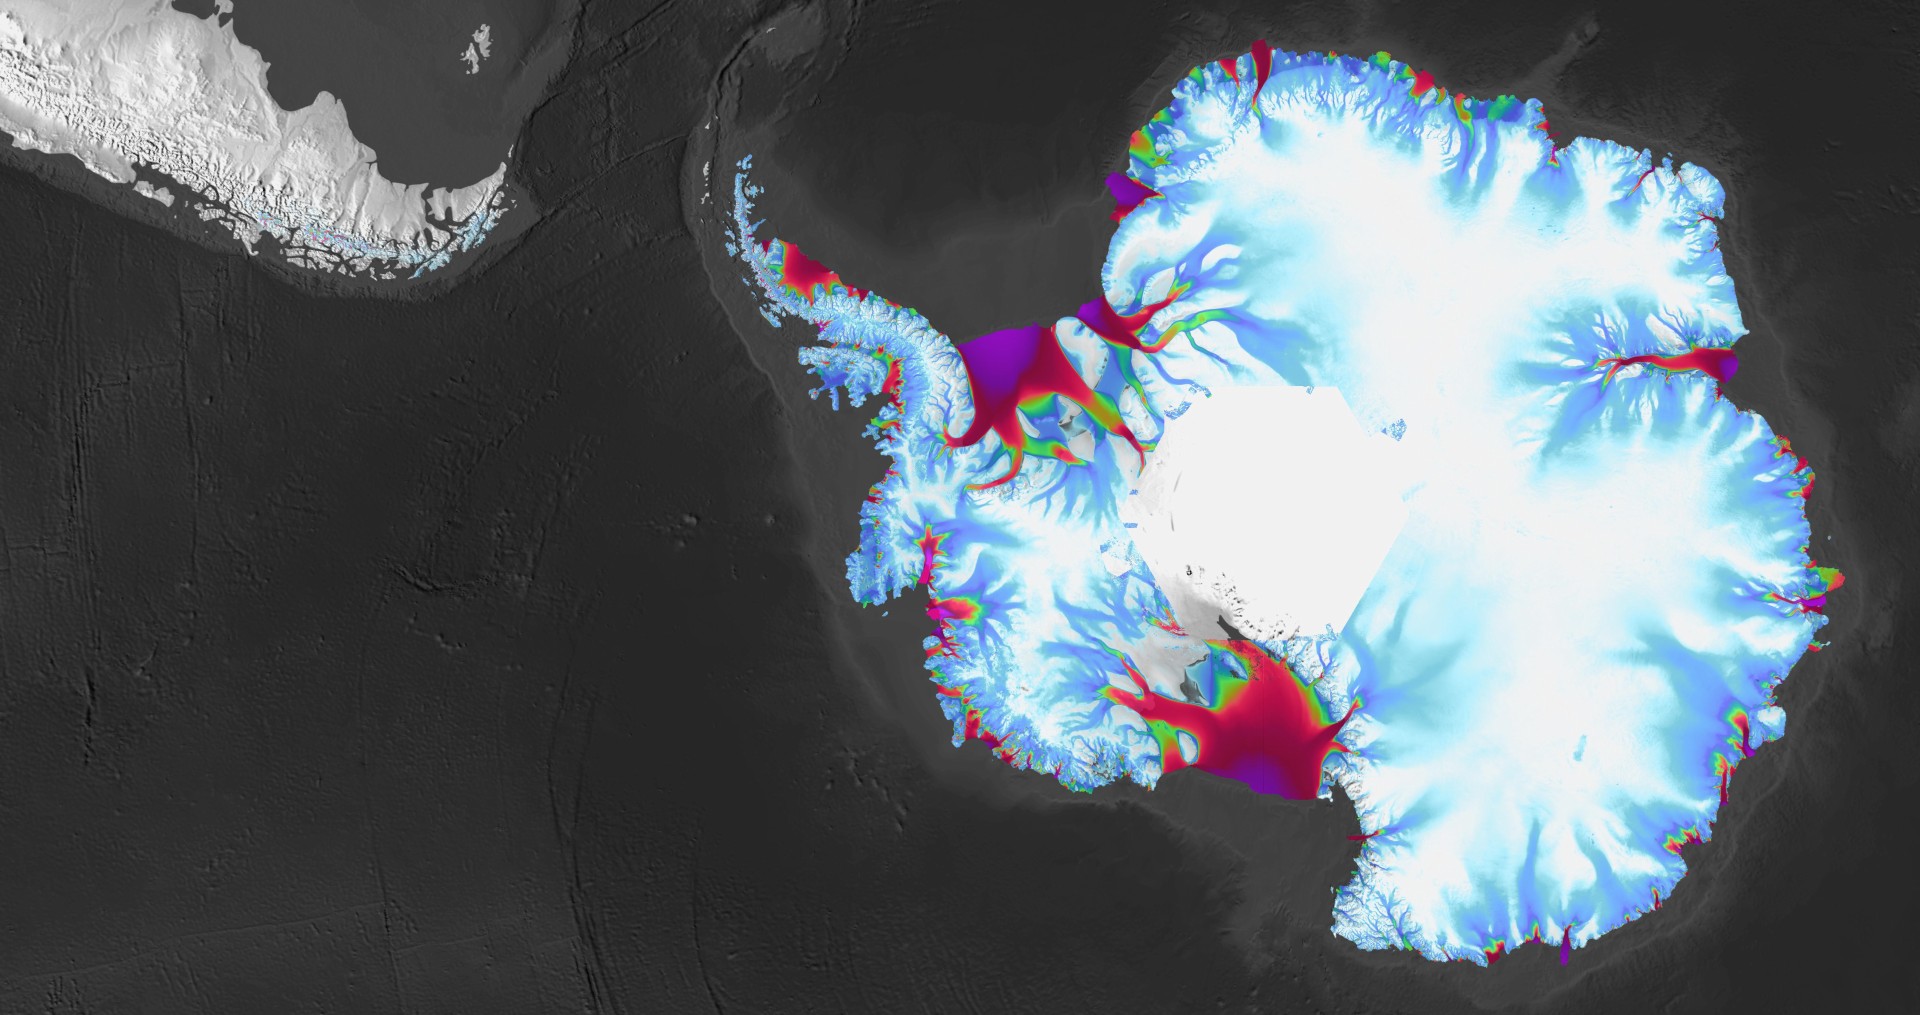
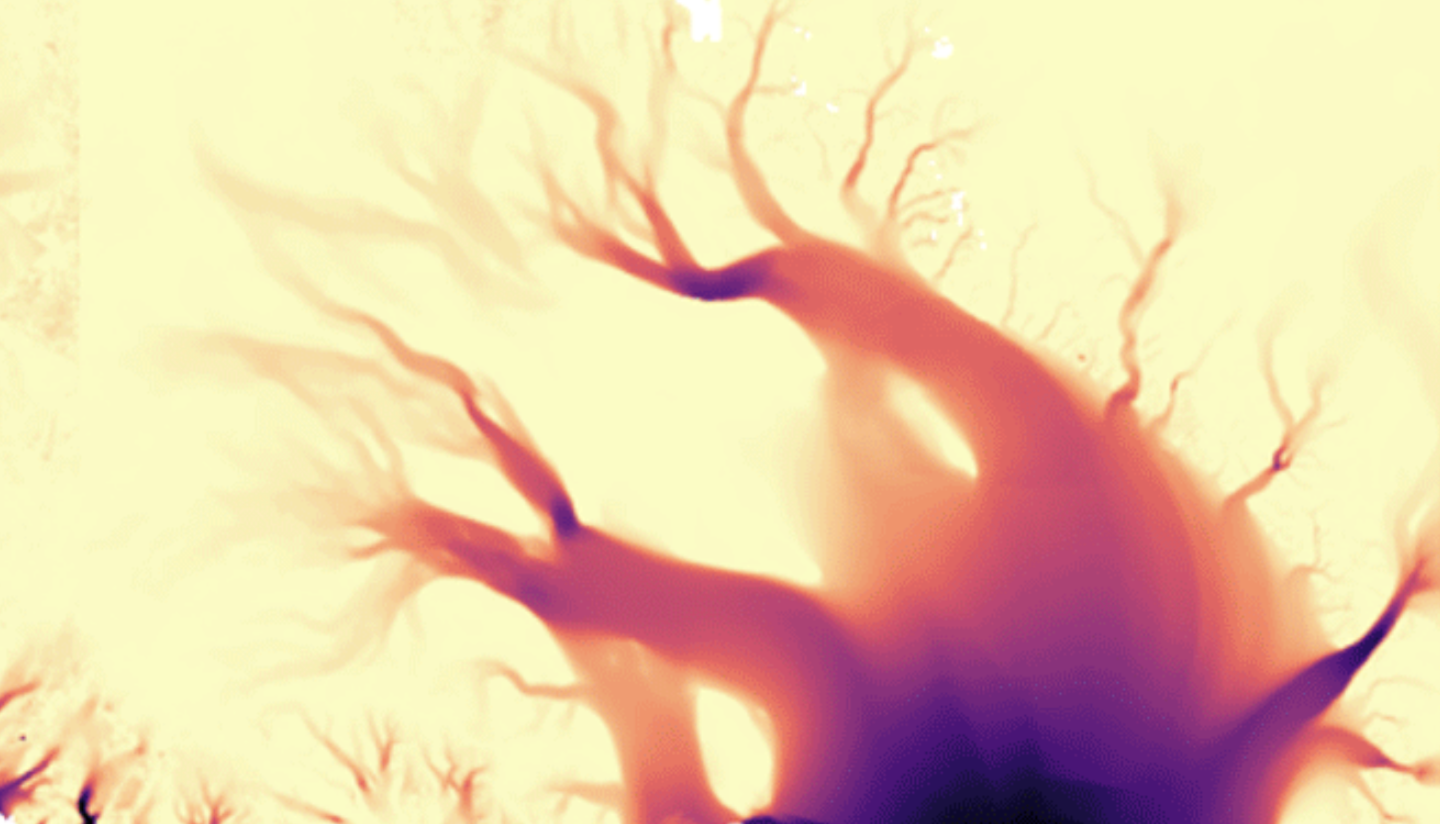
Ice Velocity. Tracking glacier speed and elevation worldwide in near-real time, spanning three decades of satellite data.
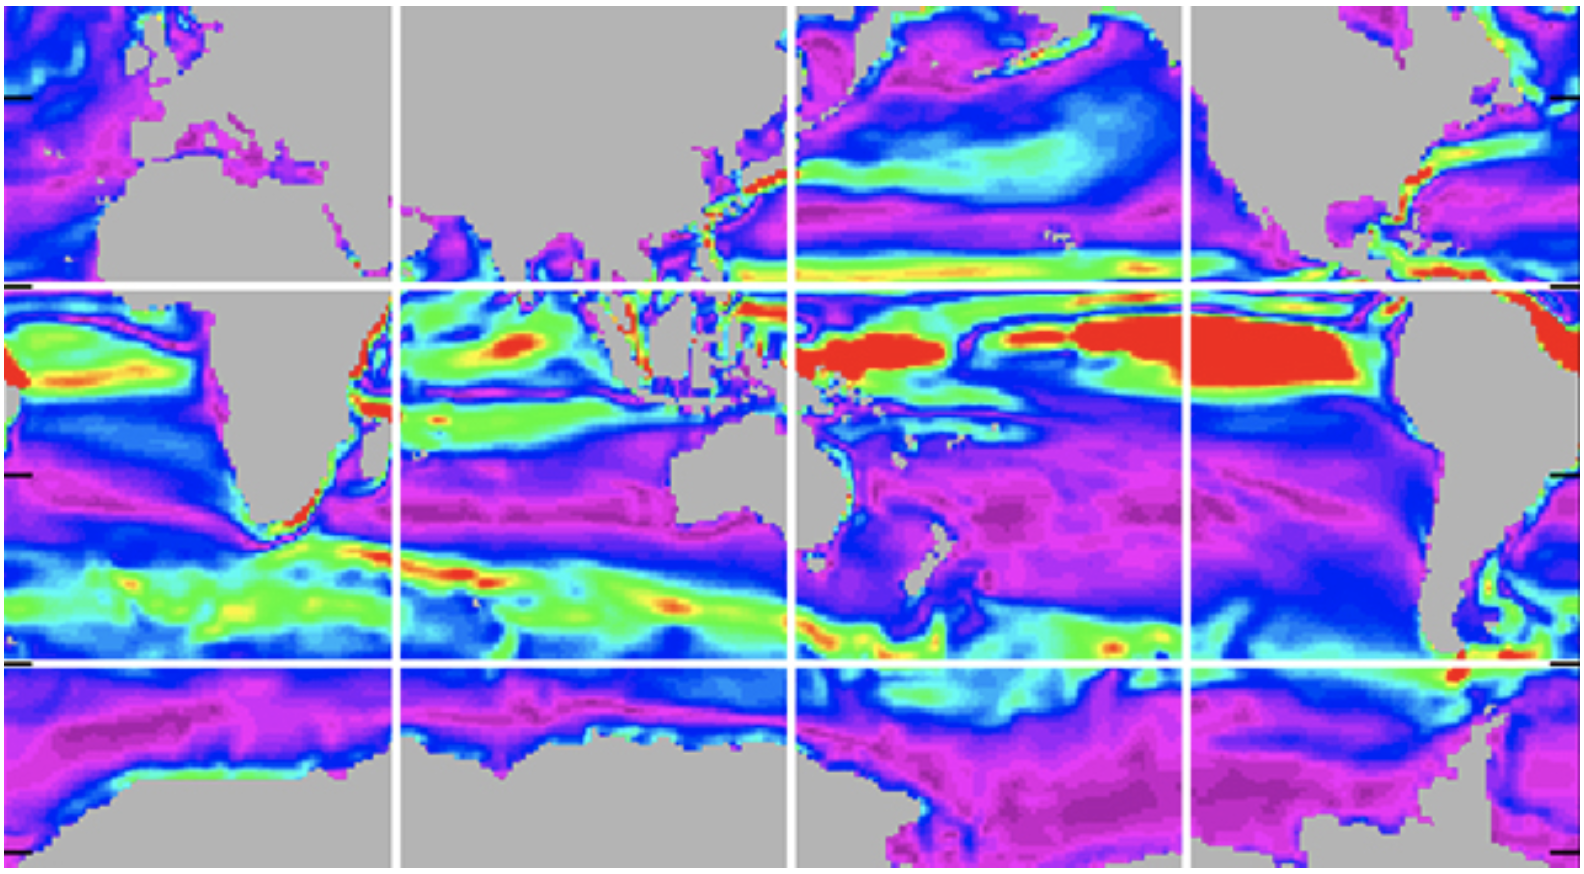
Ocean Modeling. Fusing ocean models and satellite observations to reconstruct global ocean circulation in three dimensions.
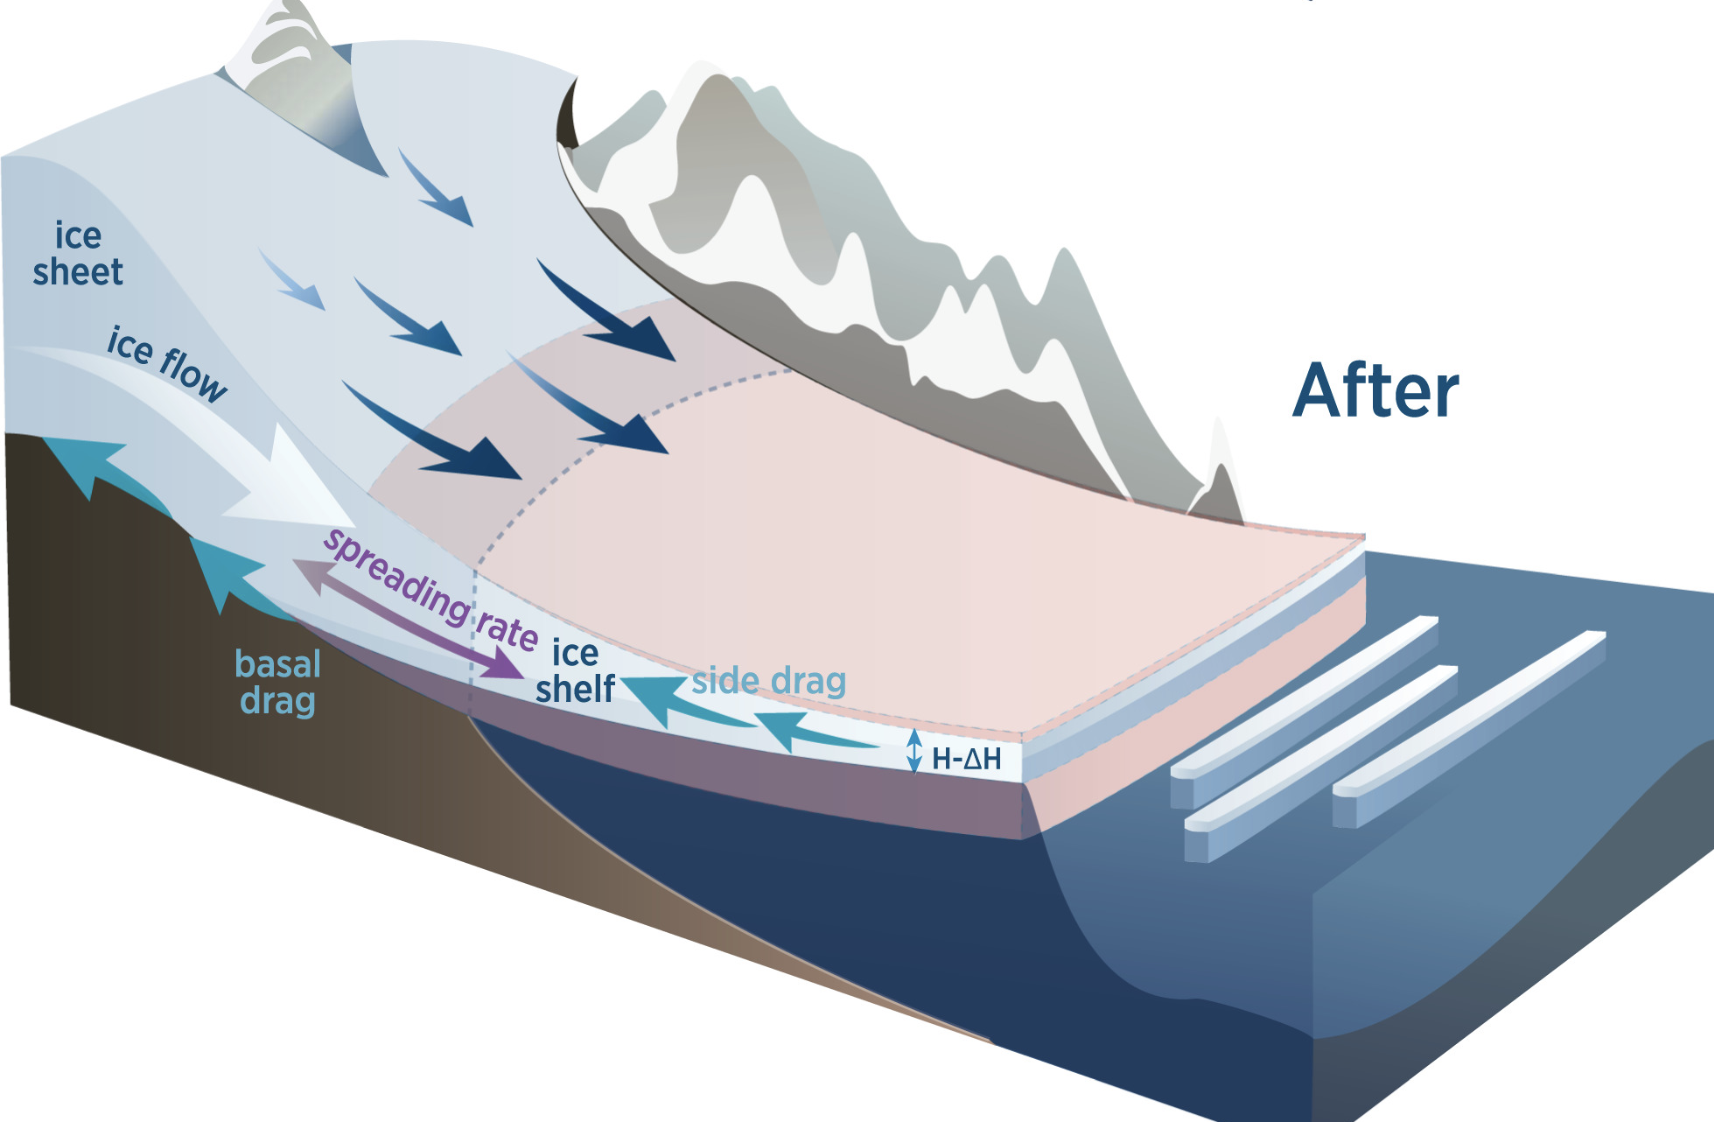
Ice Dynamics. Thinning ice shelves reduce grounding-line buttressing, driving instantaneous ice sheet mass loss.
Ice Shelves. A 26-year record shows West Antarctic shelf thinning has slowed since the early 2000s, linked to variable ocean heat.
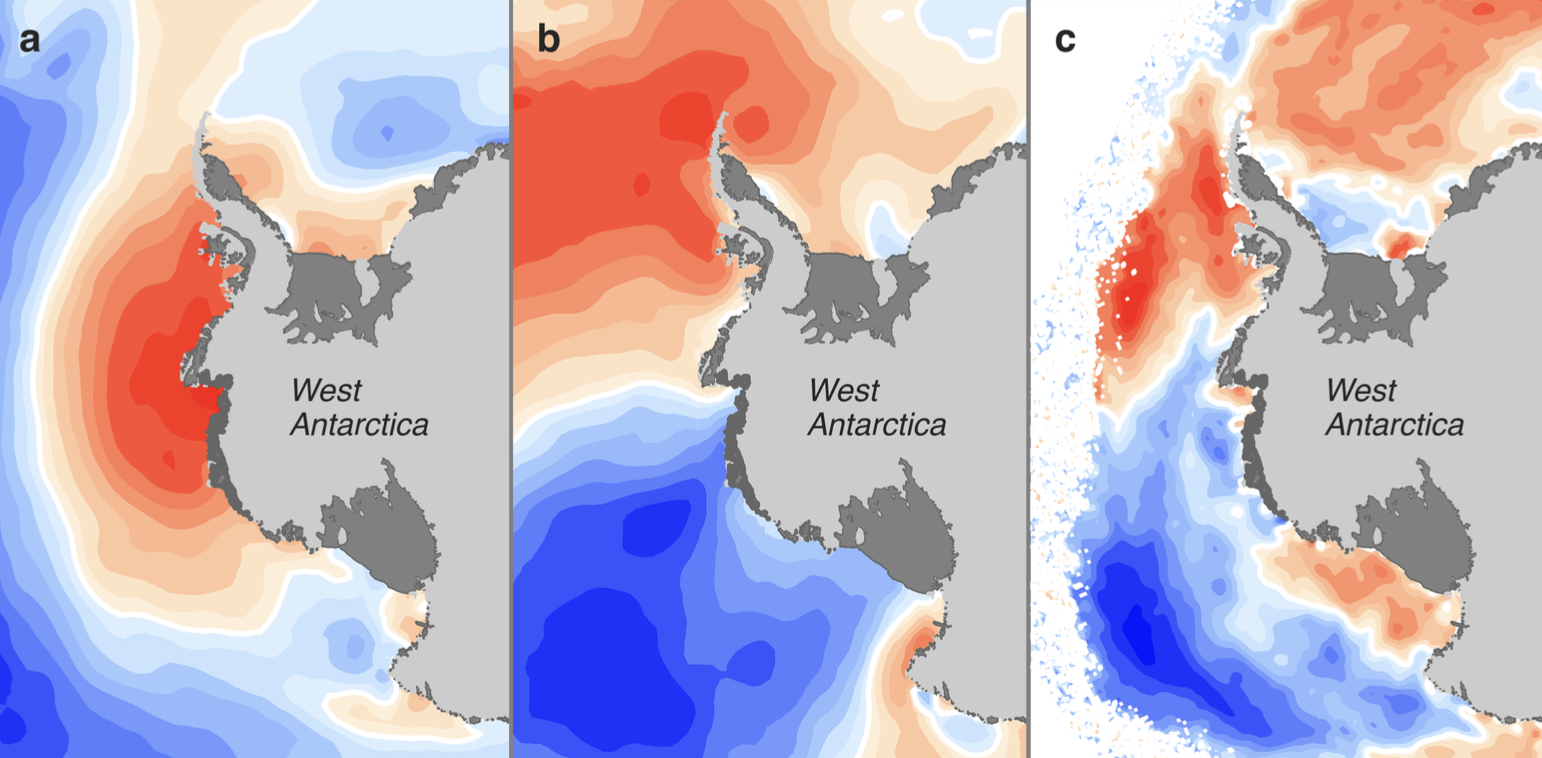
Climate. El Niño dominates interannual ice shelf mass change in Antarctica's Pacific sector.
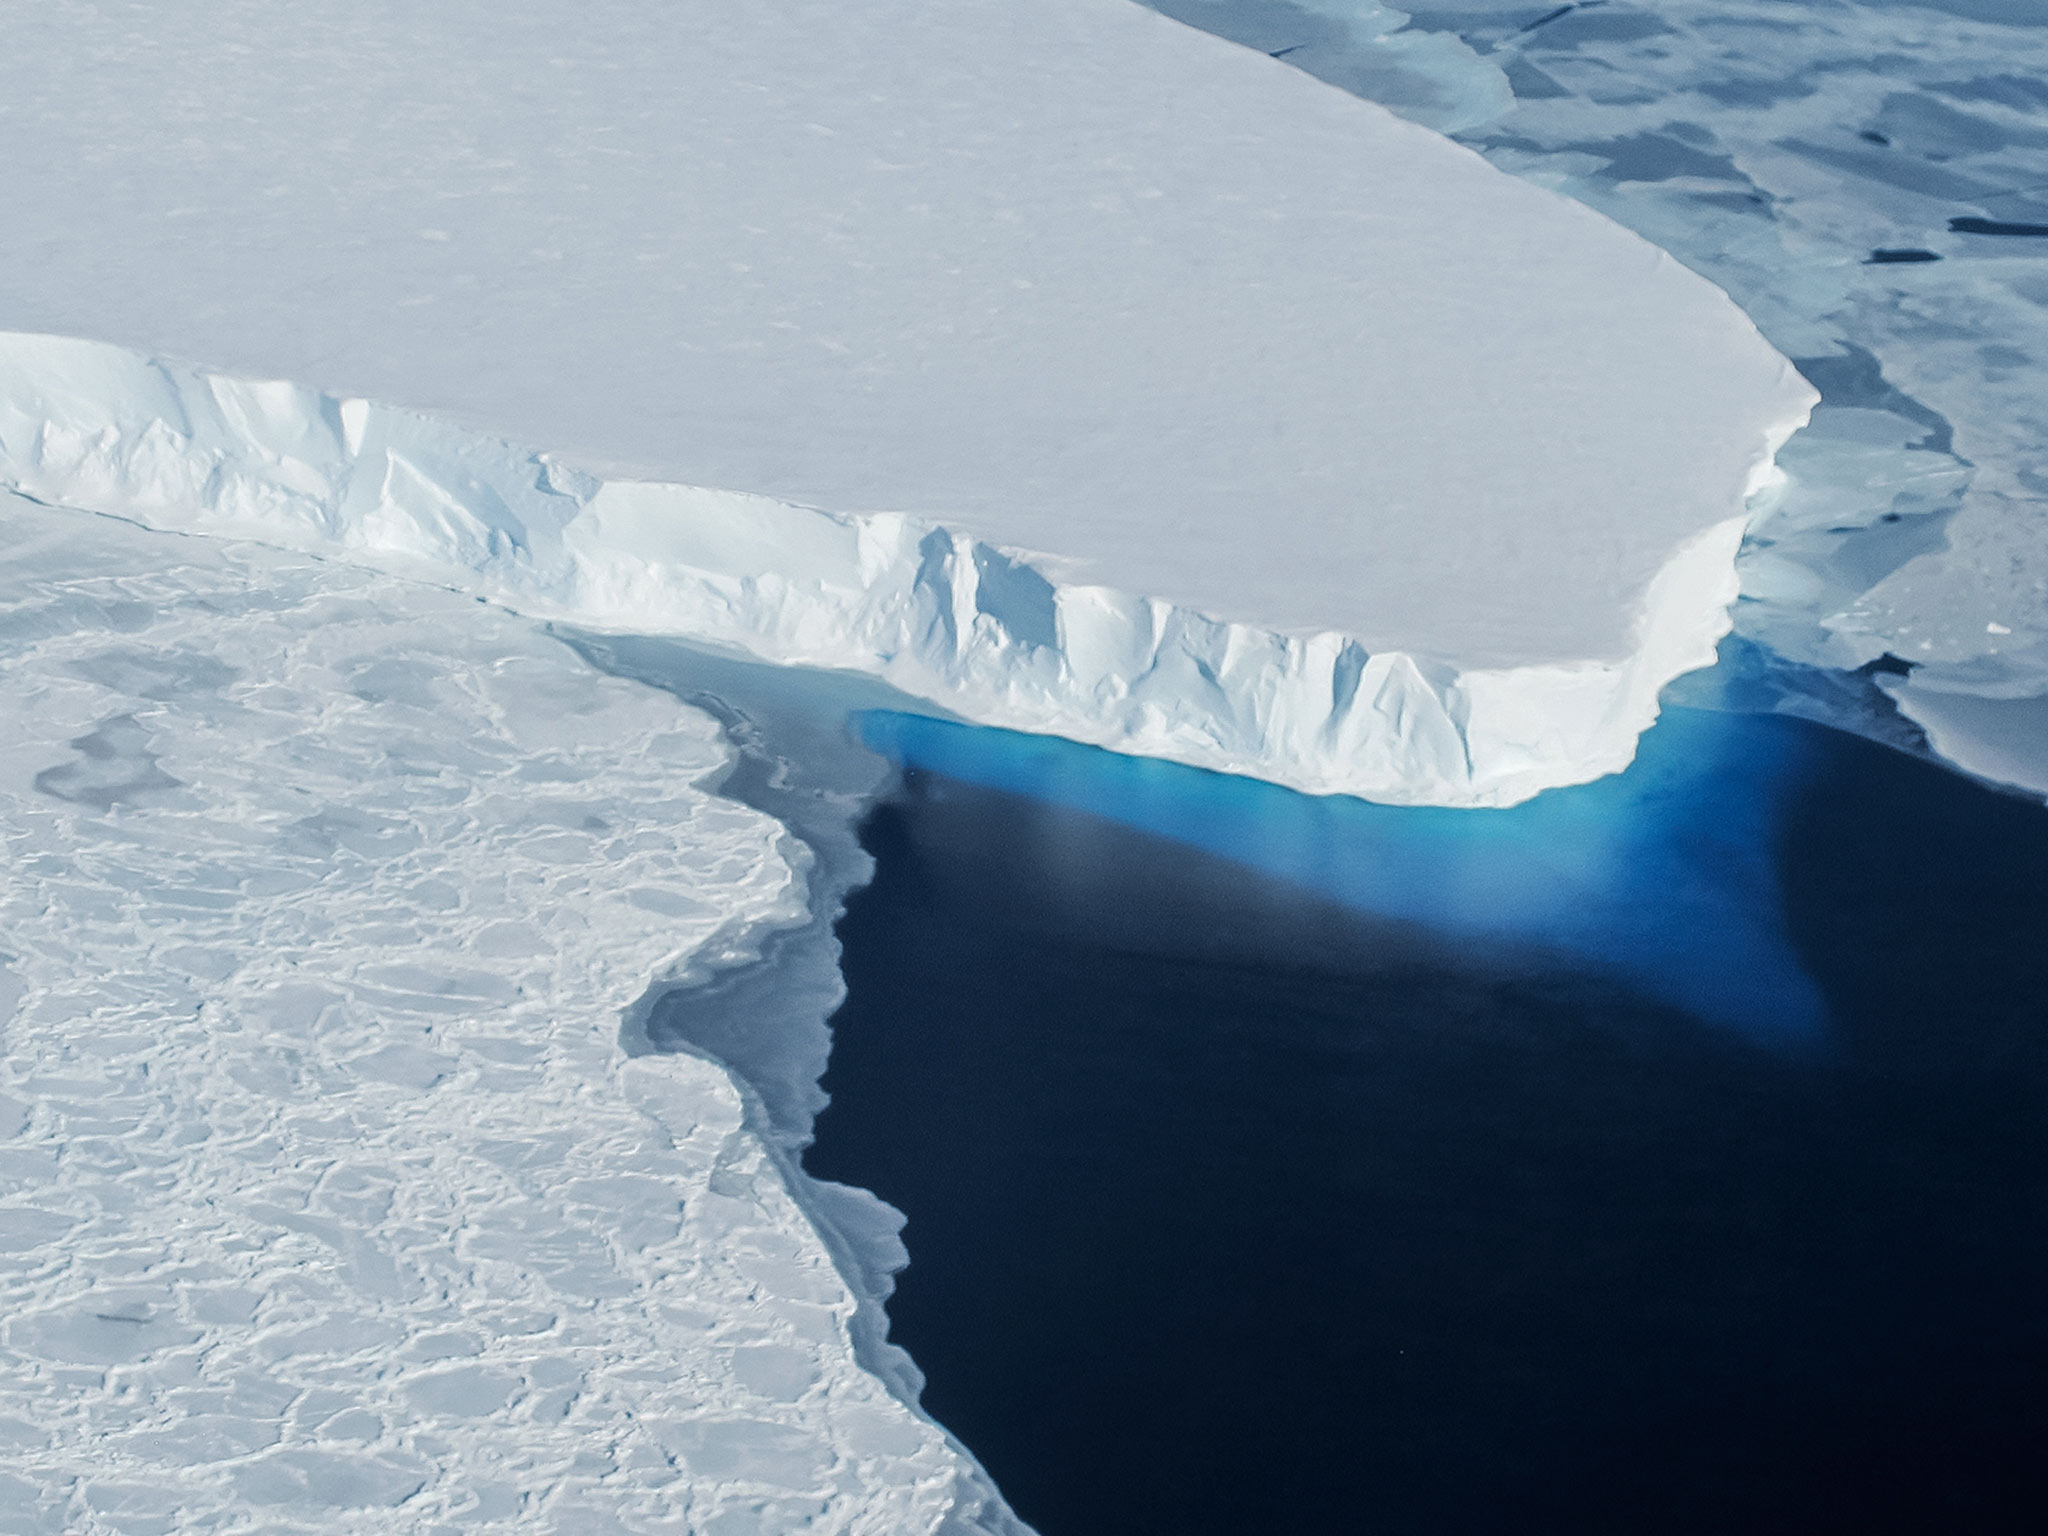
Ice Shelves. Antarctic ice shelf volume is declining, with Western shelves losing mass 70% faster than before.
Open Source. 60+ open-source Python tools for processing and integrating multi-satellite altimetry data.
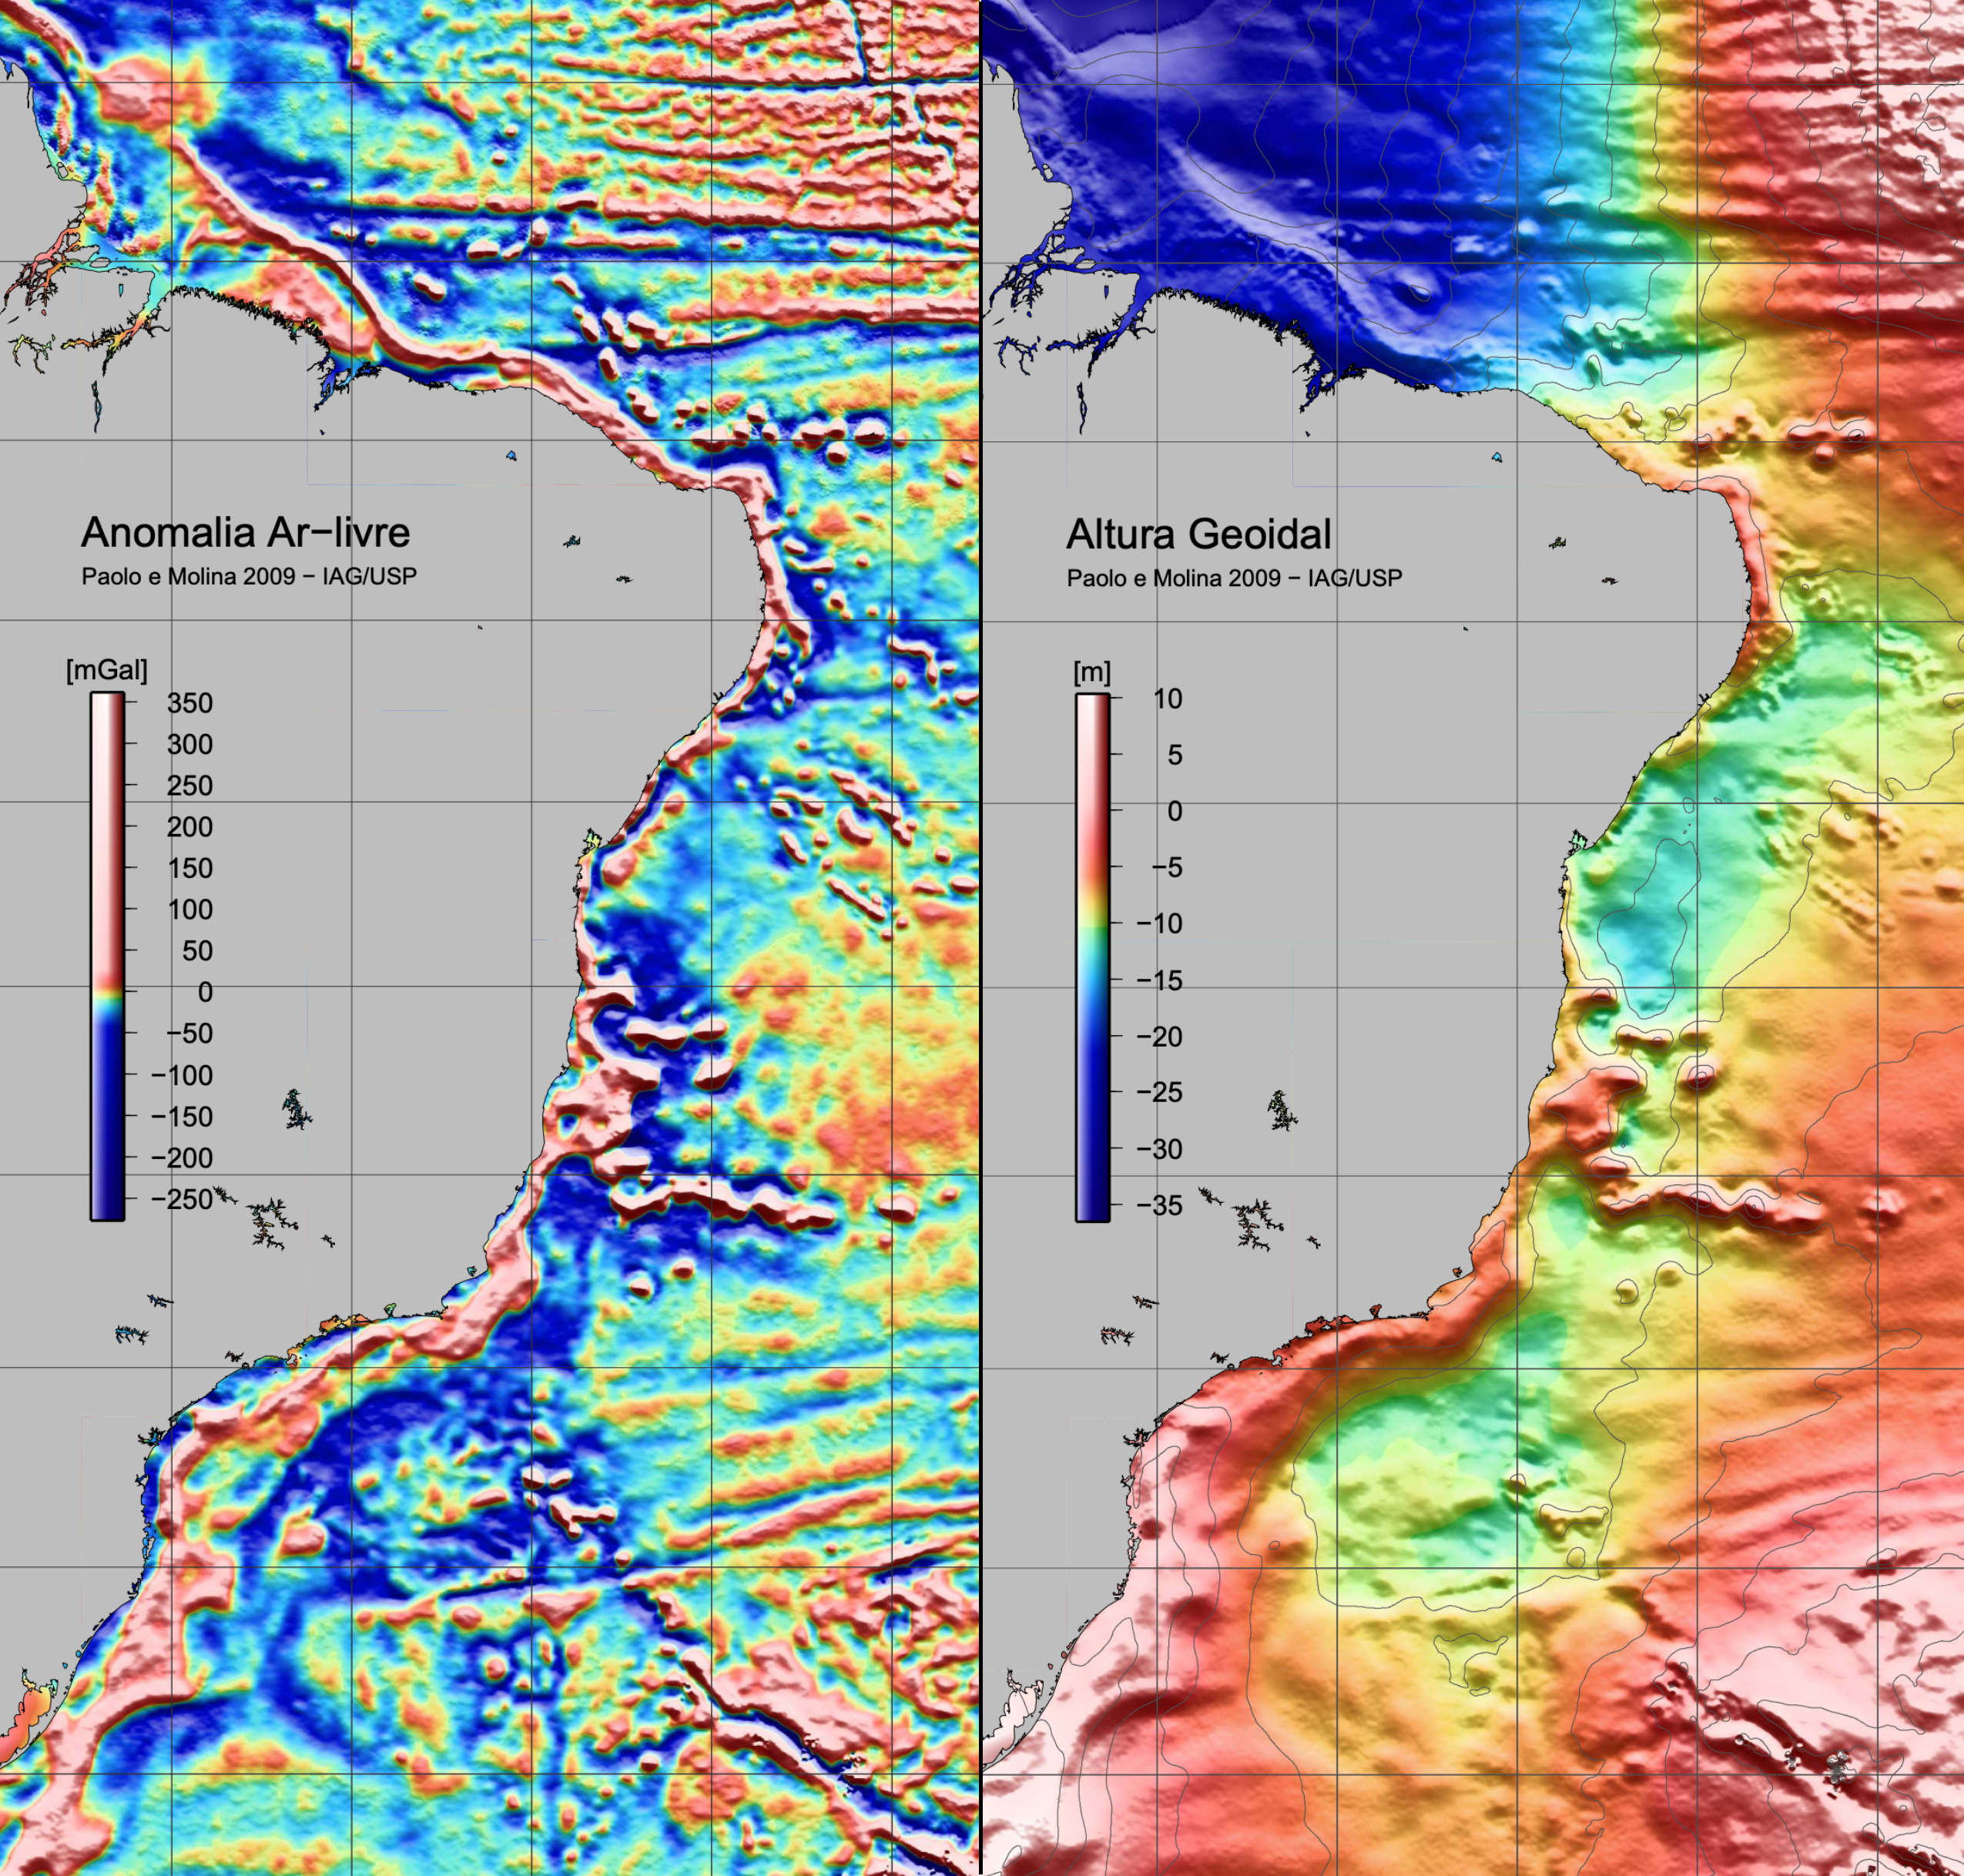
Geodesy. Combining satellite altimetry and shipborne gravimetry into a unified marine gravity field.